


Local Real Estate Market Update: Week of June 22nd

Briana Perrino-Barrett
Briana oversees our marketing department and provides one-on-one coaching sessions and regular training on our internal marketing technology and best ...
Briana oversees our marketing department and provides one-on-one coaching sessions and regular training on our internal marketing technology and best ...
This week we’re back to take a look at the local real estate market. As a reminder, this data is pulled from activity in DuPage, Will, Kendall, and Kane counties. The market is continuing to look pretty healthy, though we are still lagging behind in terms of new listings.
Take a look below to learn more!
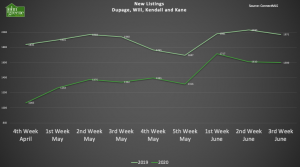
New Listings
As you can see new inventory has leveled a bit, mirroring the same trend for June of last year. However, we still trail in total listings compared to last year.
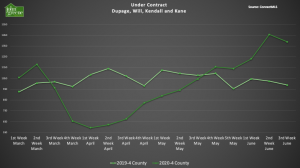
Under Contract
The under-contract level fell off slightly week over week, but still registers as the second strongest under-contract week in the past several years.
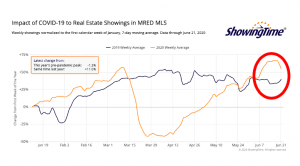
Showings
Here is the real-time showings graph which is a great forward-looking indicator. You can see that showing activity remained very strong, but saw a dip here in the past couple of days. That was to be expected at some point since we were seeing historically high levels of buyer activity.
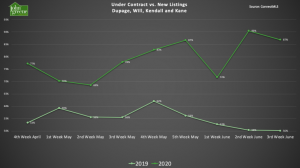
Absorption Rate
This is our favorite graph – under contract vs new listings, also known as the absorption rate. In a normal market, we tend to see this number hover around 60% (for every 10 properties listed, 6 go under contract). This past week remained historically high. If we look back at 2019, we see a flattening of around 50% which is much more typical for this time of year. So the narrative remains the same…buyers are out in full force and the market needs more listings!
Pricing
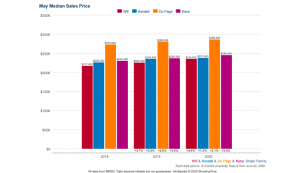
A common question we get is if prices are holding up. Here’s a good look across the 4 counties we are tracking. Let’s look at the median sales price for all closed transactions in May, which is a good indicator because a good portion of the homes sold during the height of the pandemic closed in the month of May. Compared to May of 2019 and 2018, we see that prices are not only holding up but increasing. This is a great sign, and we’ll continue to track this as we move forward.
For any questions, please don’t hesitate to call our Real Estate Resource Hotline at 630-793-0876. Our team of agents is available and happy to answer any real estate questions you may have!